


I mentioned a few weeks ago that I have picked up my 1966 NL replay after a hiatus. I have really kept pace since then and playing at least one game a day.
As I write this, there are five games left before the All-Star break.
I will eventually do a comprehensive team-by-team recap when the time comes but for now, I thought I’d step back and look at how I prepared and executed the replay so far.
What did I do right? What do I wish I could have done or done better? Is it too late to change anything for the second half?
As many of you know, I keep my own stats in an Excel format. I must be one of the few who really enjoy doing the stat-keeping as much as I do playing the game itself. Keeping my stats in a spreadsheet system allows me to dictate what stat categories I want and how I want to display them.
In short, it puts me in charge.
Keeping it real
My 1966 replay is NL only and uses the actual 1966 MLB schedule, starting lineups, and starting pitching rotations. Defensive substitutions, pinch hitters, and relievers are at my discretion. I also implement trades and acquisitions as they take place.
This all took a lot of preparation and meant I had to stay on top of everything. Am I glad I did it that way?
In a word, yes!
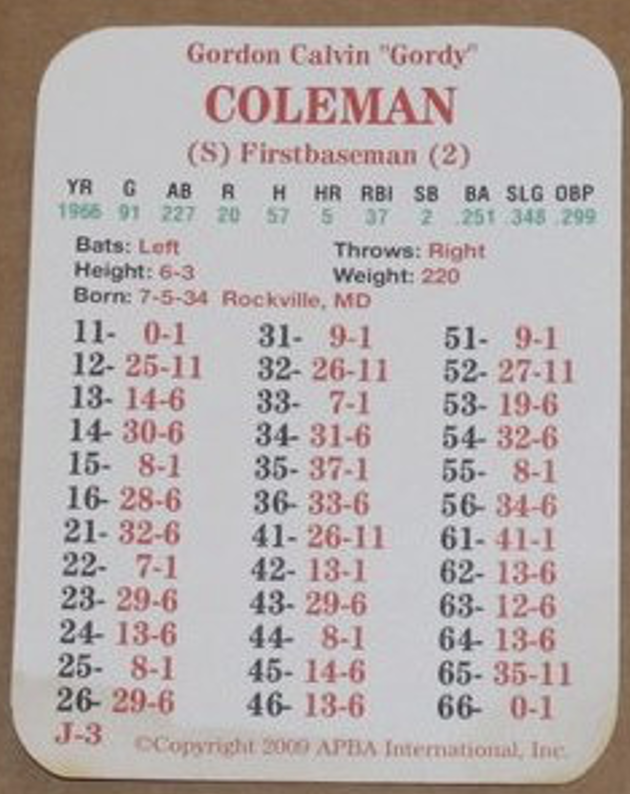
I could have easily played the best eight players every day and be done with it. Instead, I learned a lot about how the game of baseball works (at least in the 60s). Managers didn’t just have APBA cards to look at when making lineups. Some were basing their hunches on their players’ projections, scouting reports and previous years’ stats. Some just didn’t pan out. For example, why in the world were the Reds batting Gordy Coleman fourth when he was a mediocre hitter with two zeroes?
As it turns out, Gordy had a solid year in 1965 batting .302 with 14 homers in 108 games. The Reds were expecting more of the same in 1966 but in actual play, he only hit five dingers with a .251 batting average.
I grin and bear it and wait for Deron Johnson to come up after him.
What is important to me?
At the very beginning, I decided which stat categories were important for me to keep. Aside from what my league normally keeps, I added a few.
Hitting stats
G, AB, R, H, 2B, 3B, HR, RBI, BB, SO, SB, HBP, DP and SH
Pitching stats
G, GS, CG, IP, H, R, ER, HR, BB SO, W, L, Sv and Sho
From there, I could extrapolate averages, streaks and other fun stats with simple formulas (okay, I lied. The hitting streak formula is pretty complicated). The stat categories I added were DP and SH for hitters and HRA for pitchers.
Are there stat categories I wish I had included? Not really. Looking back, I feel I covered the bases. Here are few I considered but dismissed:
- Appearances by position (too much work for the reward)
- Caught Stealing (APBA Basic game doesn’t reflect this much)
- Intentional Base on Balls (that stat just isn’t that important to me)
No, I don’t even bother with fielding errors. Too many.
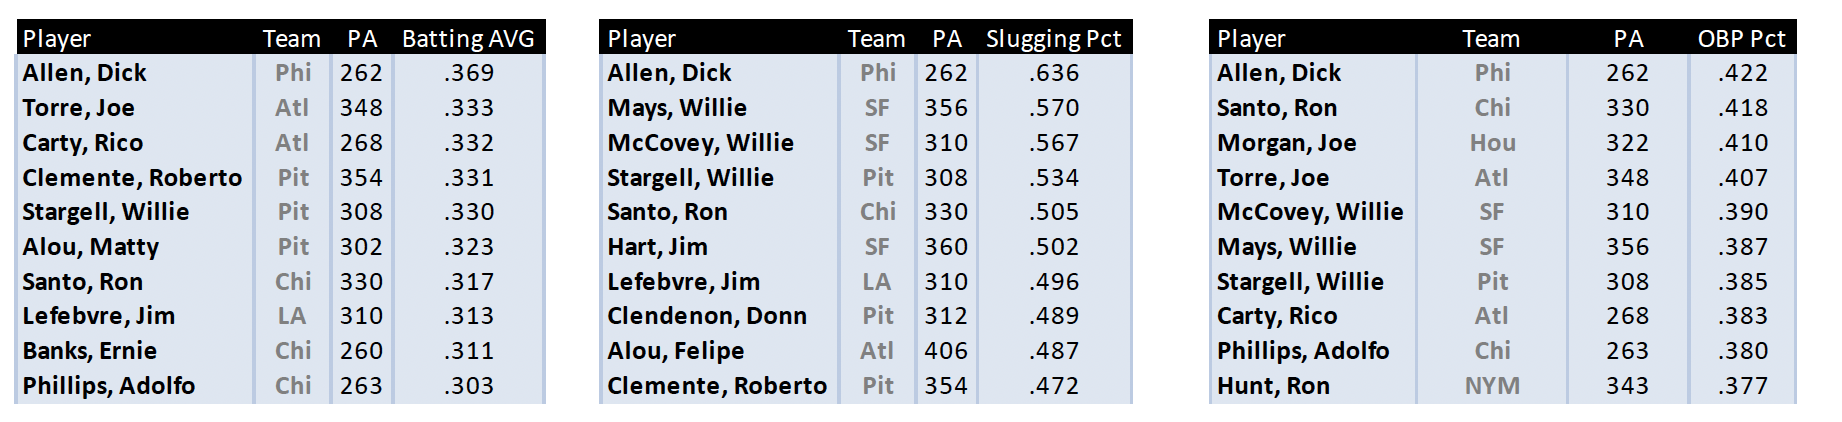
Speaking of defensive positions, there are a couple of stars who played in 1966 who split their time between more than one defensive position. In particular, Felipe Alou (1B and OF) and Dick Allen (3B and OF) were high profile stars who weren’t dedicated to one position. In addition, Willie Stargell and Joe Torre come to mind.
Still not worth keeping the extra stat.
Game stats
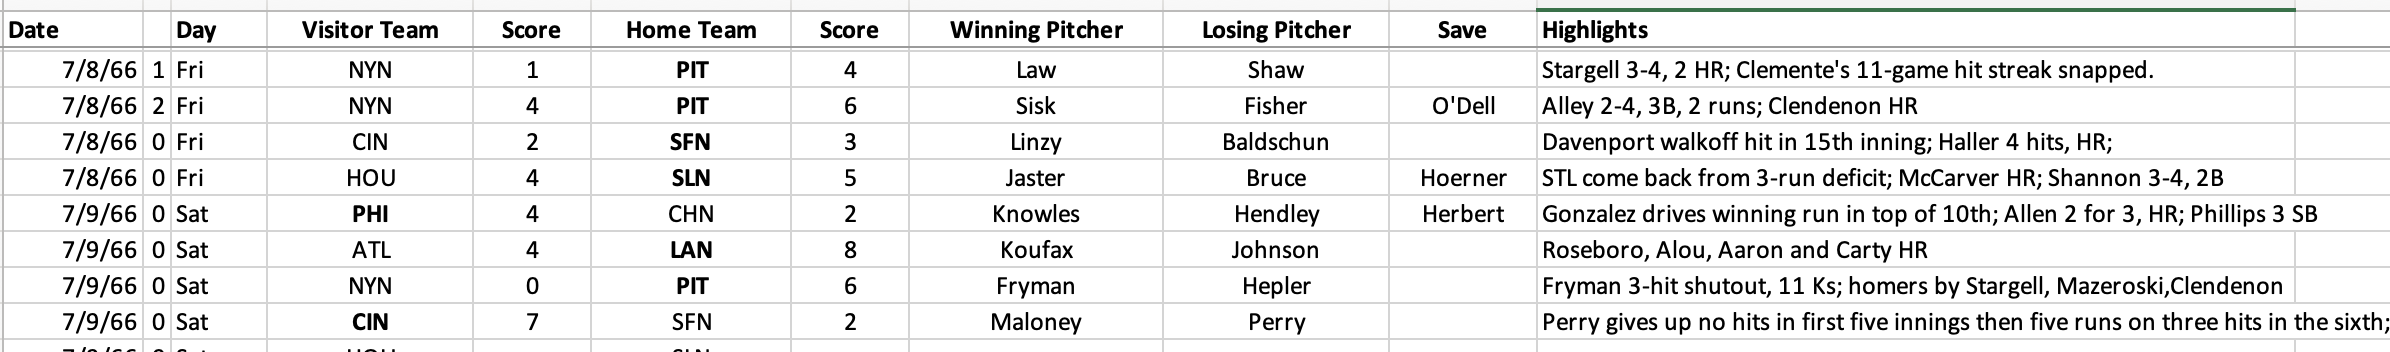
This is a topic I wish I had addressed more at the beginning. In my Game Results listing, I did not tag each game specifically if it played was an extra inning affair. That would be a cool figure to have. I usually mention it in my highlights field but I’m sure I missed a few.
Maybe mentioning which games were walk-offs would be another possibility.
Before replaying each game, I go to baseball-reference.com and get the actual starting lineups for the day. Another thing on my wish list is to pay more attention to that box score. In particular, who subbed in for the OF-1 or the SS-7? Too often, I just let the starting eight play the full nine innings.
Pitching in the 1960s
Even now, I am still getting a handle on how pitching is managed in 1966. Too often, a winning team goes into the ninth inning with a one-run lead and I’m thinking, “Time to bring in the closer”.
The thing is, that isn’t exactly how pitching worked back in the 1960s. A team’s “closer” would have maybe 10-15 saves for the season. Phil Regan was the NL saves leader with 21. Bullpen aces were geared to pitch two or even three innings, if needed.
In addition, a lot of starting pitchers would come in relief maybe 5 or 10 times over the year. Miguel Cuellar who was second in ERA in real life, made ten appearances out of the bullpen. Think outside the box, Tom! Miguel is there if Houston needs some bullpen help.
The lesson here is that replayers should research their era if they want realistic results. I bet deadball replayers like Scott Fennessy really need to do their homework.
Am I satisfied with my results so far?
Yes, I am, and this is why.
I think all replayers want some semblance of realism when we play APBA. In our replays, we want the Willie Mays’s to do well and the Jerry Buchek’s to struggle as they did in real life.
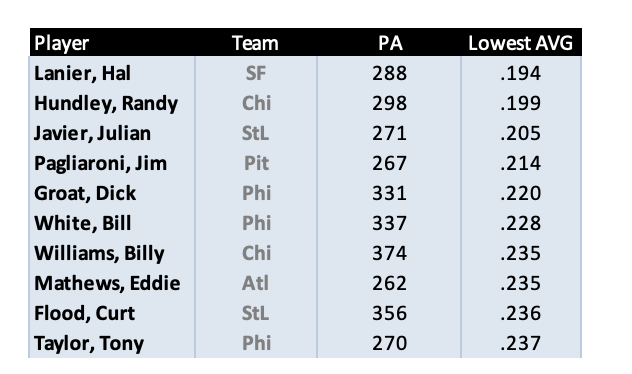
That said, I don’t mind a randomization factor so that the replay doesn’t simulate perfectly. Yes, Hank Aaron was struggling a bit early on in my replay but he’s picking it up now. And Julian Javier? He hit FIVE homers in the month of April. That said, he hasn’t hit one since.
The point being, just like real life, everything equals out in the end. I’m sure my Cubs will fall from grace. They are already descending from their lofty seventh-place position and will replace the St. Louis Cardinals who have been woefully underperforming.
It won’t be long before I’ll be posting a first half recap. Since I started writing this, I even played one more game (chalk up a W for the Reds’ Jim Maloney!).
Thomas, I have experienced some strange things with APBA. In my first replay of the 1966 season, Pirate shortstop Gene Alley hit in the 290s almost his exact batting average. Half-way through my current replay, he is hitting .180. And this is after a great series where he hit well. Prior to that 4-game series he was only hitting 145! Another guy is Pirates 1960 Don Hoak. In real life he hit around .285 with maybe 16 homers and a .366 OBP. In two replay seasons, he barely hit .200 in either season. Another example. Willie Stargell in 1971 had 48 homers. Half way through my replay, he has only 12. In short, with very few exceptions, my APBA players always hit way below their actual batting averages each season. Some players, like 1960 Dick Groat, who hit well above .300 that year, only hit 260 in my replay. But he gets a ton of errors on base, that brings his OBP up to snuff. Roberto Clemente never hits anywhere near what he actually hit for my 1960, 1966, or 1971 teams in multiple replays, but Matty Alou and Manny Mota performed as they did in reality. MY QUESTION: How accurate do you think APBA cards are? Why would so many of my good players hit 50-60 points or more below their batting averages? Thanks! My buddies blame it on me for being an unlucky dice roller.