


Another feature of the Fielding Range Chart is speeding up the identification of catcher’s wild throws on safe steals.
Rather than flip through the pages to see if a catcher’s throw found its way into center field, use this feature on the chart to see if there even is a wild throw to begin with.
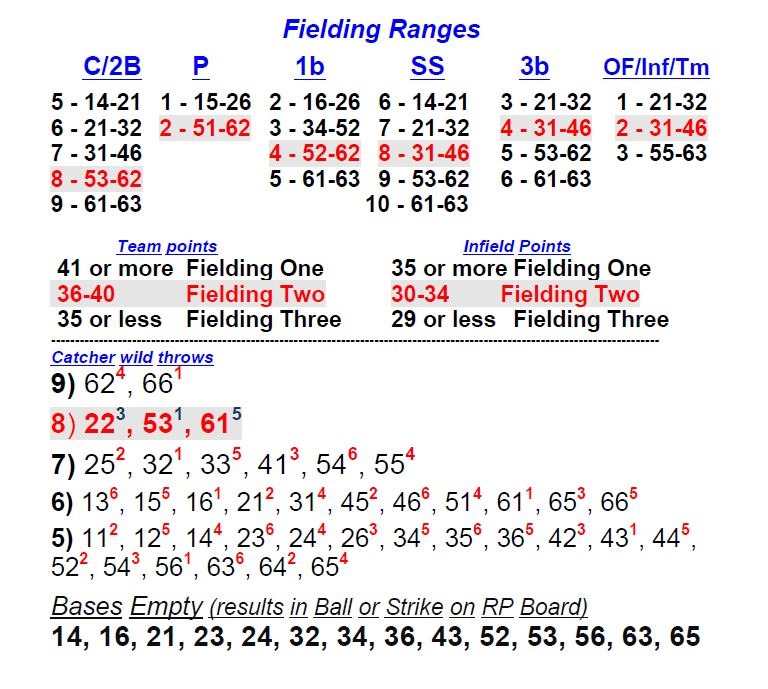
The chart lists all the various catcher ratings from 5-9. Alongside the catcher rating are all the numbers that are associated with wild throws for that particular catcher rating.
Under C-7, for example, there are six numbers that potentially can result in a wild throw: 25, 32, 33, 41, 54 and 55.
Here’s how it works
If a runner steals a base, you roll the dice. If one of the numbers for the particular catcher’s rating appears, there is the potential for a wild throw. Alongside each of those numbers is a smaller number, which indicates the wild throw number (using one die).
For example, Billy Hamilton of the Reds steals second and you have Matt Wieters, a C-8 behind the plate. You roll a 22, which indicates that there could be a wild throw. You roll one die and, if the die reads “3”, then there is a wild throw. Consult the appropriate base situation chart to determine what happened after the wild throw.
Wild throws by catchers don’t happen very often. And, by using the Fielding Range Chart, you can save a lot of time and flipping back and forth to pore throw the ABPBA booklet to see if the throw is wild or not.
Next: Dropped throws on stealing tags