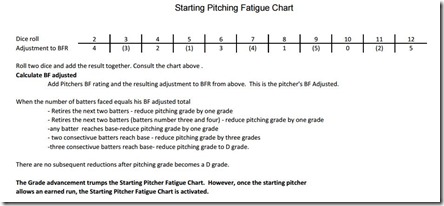
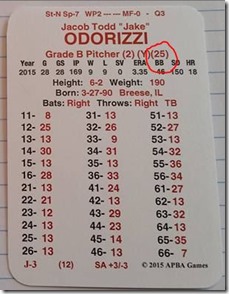
The APBA Company quietly rolled out the Starting Pitching Fatigue Chart with the new season. Those of you who received new cards may have noticed a new rating with the pitchers’ grade. The fatigue rating appears as a number right after the strikeout and control ratings on the same line as the pitcher’s grade.
See the highlighted fatigue rating on Jake Odorizzi’s APBA card.
This fatigue rating is to be used with APBA Starting Pitching Fatigue Chart which is found on APBA’s web site here. As far as I can tell, this fatigue rating chart is meant to be used as an advanced feature for the Basic Game. Though it could be used with the Master Game, that game has its own fatigue system with the Q rating.
How does it work? To put it VERY simply, two dice are rolled and added before the game. You then refer to the chart. That gives you an idea how many batters the pitcher can face before his grade is affected. There are additional rules regarding whether or not he retires the following batters which may quicken his demise.
As a point of information (because I was confused by this), the numbers in the parenthesis are to be subtracted from the BF Rating.
Note that if your pitcher hasn’t given up an earned run, he is still subject to the grade advancements as per usual APBA rules, UNTIL he gives up a run.
In concept, I like the idea of a pitchers’ fatigue system especially for replays. I haven’t had a chance to test this one out yet though. Has anyone test driven this Starting Pitching Fatigue System out? I’m curious how it’s worked for you. If so, post your results.


I have been using the fatigue Chart for a little over a week now… Played 28 games with my 1975 Replay. I went on the Baseball Reference site and calculated each starting pitchers BF number… It has added a new wrinkle to my replays… Doing Adjusted BF with the chart changes how I handle my staffs. I use the BF # as a guide for how much to use a starter on each start… it is more like real life in that some days the chart adds to the BF # and you can assume your starter is fully rested and ready to throw thru a wall. Other days the chart may take away from his BF # and you imagine you hurler is just not feeling it… One or two bad innings could limit him to 5-6 innings of work. I also have made my own changes and calculated the reliever BF # as well… If a reliever only averaged 5 batters faced per appearance, he will just get in maybe 2 innings of work… I have really enjoyed this addition to the basic game… Plan on continuing using it !
Hi Eddie,
thanks for the great review of the system! I’m glad you’re liking it. I imagine it will take a while for it to get wide use but I may give it try myself.
Tom
I’m a basic game user but mostly replay the 50s, 60s and some 70s seasons. I am kind of leaning toward using this in the age of specialization—modern seasons only (90s to present) since my season replays of the 50s & 60s had so many complete games.
What do you think?
I liked Eddie’s idea. So, I’m going to give it a try in my ’70 Orioles replay. I followed his idea and went on BR to figure out every pitcher’s starting factor (bf/g or gs). Takes a little extra time when you have pitchers with split ratings.
No. I play the Master Game and use the Q rating
Hi,
Can someone please provide more detail on the following “The Grade advancement trumps the Starting Pitcher Fatigue Chart. However, once the starting pitcher allows an earned run, the Starting Pitcher Fatigue Chart is activated.”
Does that mean that if a pitcher does not give up an earned run all game he does not become fatigued?
Hi Chase –
Essentially, yes- APBA built in the “upgrade” system to allow pitchers with lower grades to pitch deeper into games if they don’t allow any runs to simulate a pitcher “hitting his stride”. Using this tool gives any starter a chance at a shutout or a no-hitter (Len Barker 1981 for instance?), which would be darned near impossible without following this rule.
For example, let’s use Bob James from the ’86 White Sox. D rated pitcher, low BF (21, I think). If James gets through the first five innings without allowing an ER, he upgrades to a C at the start of the sixth inning. 1-2-3 Sixth? Start of the 7th, he moves up to a B. Another clean inning? He’s an “A” pitcher to try to close it out in the 8th and 9th.
However, I would say use your best judgment in using this tool. I’ve had D pitchers make it into the eighth inning but load the bases on three straight walks. At that point, a real MLB manager would visit the mound, pat the guy on the butt, tell him “Nice game, but you’re throwing watermelons,” and signal to the bullpen. Pitcher still hasn’t given up an ER yet, but he’s obviously toast.
Just remember, there are so very few hard-and-fast rules with APBA. It’s one of the reasons why I love this game. If you like it, use it. If you think it’s stupid, or doesn’t apply to how you play, then leave it out if you can, or modify it to suit your purposes.
I won’t have my new set of cards until later in the month, but if someone could give an example of how it would play out I would consider it.
I once remember vowing I could not figure out the advanced fielding charts and now use them in all games.
As a newbie perhaps you could help me out. I just got the 1989 set and I’m doing a mini replay of the season. So I can’t use this system right? Because the cards are older?
The Game Company has an instruction sheet to calculate your own ratings:
http://apbagames.com/wp-content/uploads/baseball/Fatigue%20Ratings/Calculating-Pitcher-Fatigue-Ratings.pdf
You can probably get all the data at baseball-reference.com and put it in a spreadsheet. Then you can use it with the APBA Fatigue Chart (the corrected one):
http://apbagames.com/wp-content/uploads/baseball/Fatigue%20Ratings/Starting-Pitcher-Fatigue-Rating-Chart_corrected.pdf
Enjoy!
Thanks, Steve! I was just commenting on Jeremy’s comment but was not aware of this page.
thanks for the info!!
I do use a version of this fatigue chart, but I don’t like the way the numbers are aligned. The result on “7” (statistically the most common result of two added d6’s) is a -4? That seems rather unfair, especially to lower-grade starting pitchers who only have a 20 or 21 BF rating to start with.
I actually use a “natural” version of this chart. “7” (most common roll) gets a result of zero, meaning the BF rating is not adjusted at all. “6” and “8” are -1 and +1 respectively, “5” and “9” are -2 and +2, etc. The least common rolls (1-1 and 6-6) are the -5 and +5. This way, there’s still some randomization. Even pitchers with a 30 or 31 BF rating can have days where they get fatigued a bit. And the pitchers with the low ratings are going to have days where they’re outta there by the third inning because they just aren’t hitting the strike zone, but sometimes they can tough it out a bit longer. Besides, pitchers with low BF ratings are usually C or D rated pitchers anyway, so the fatigue rating stops mattering once they have given up an earned run – once they hit “D”, the manager will yank them as soon as they’re no longer being competitive on the field.
Thanks Steve!!!!
I am going try this out, as I have had way too many starters piling up innings with the basic game. It might be a nice, easy fix for the basic game, which I prefer over longer, tedious, albeit more realistic games.
I would love if APBA Basic would be modified to be that same as Skeetersoft’s from a pitcher’s rating system. It’s the cat’s meow.
I am using a trimmed down version of this system for the MASTER GAME. Ironically, I think that the numerical version fits better with the master game, and at the same time if I was using the “Q” ratings, I would be more apt to use those if I was playing the baseball game. In other words, this is one time where I thing APBA criss-crossed modifications for their basic and master game. Anyone else see it that way?
We use a modified version for the Master Game. BF allowance is the base for each pitcher. The next three batters after the BFA is reached lowers the pitchers rating by 2 points each. The fourth batter by an additional 5 points and fifth by 5 additional points. This is similar to the standard fatigue as each grade is equal to 5 points. For example a pitcher, grade 19, has a BFA of 29. On the 30th batter, the grade is reduced to 17. 31st batter = 15 grade. 32nd batter = 13 grade. 33rd batter = 8 grade. 34th batter = 3 grade. 35th batter = 1 grade (minimum grade allowed.)
We still apply the grade advancement for no earned runs (+5 points depending on grade and innings) however they are applied along with the fatigue. Rationale is even though a “poor” pitcher may be ‘hitting their stride’ and gaining the grade advancement, they’re still throwing pitches and tiring.
So far it’s seemed to work well as honestly most starting pitchers have BFA in the high 20s to low 30s, enough for most to get through 6-8 innings under normal circumstances.
The more I think about this fatigue chart … isn’t pitcher fatigue already built into their grades?
I would rather go with different grades for innings 1-3, 4-6, 7-9 for starters.